I've been writing recently about posts being worthless in the AI era, and explored different ways of navigating content through graphs, I keep coming back to the idea that there are other ways to tell stories and share information that deserve a bit of exploration ... plus it's a bit fun!
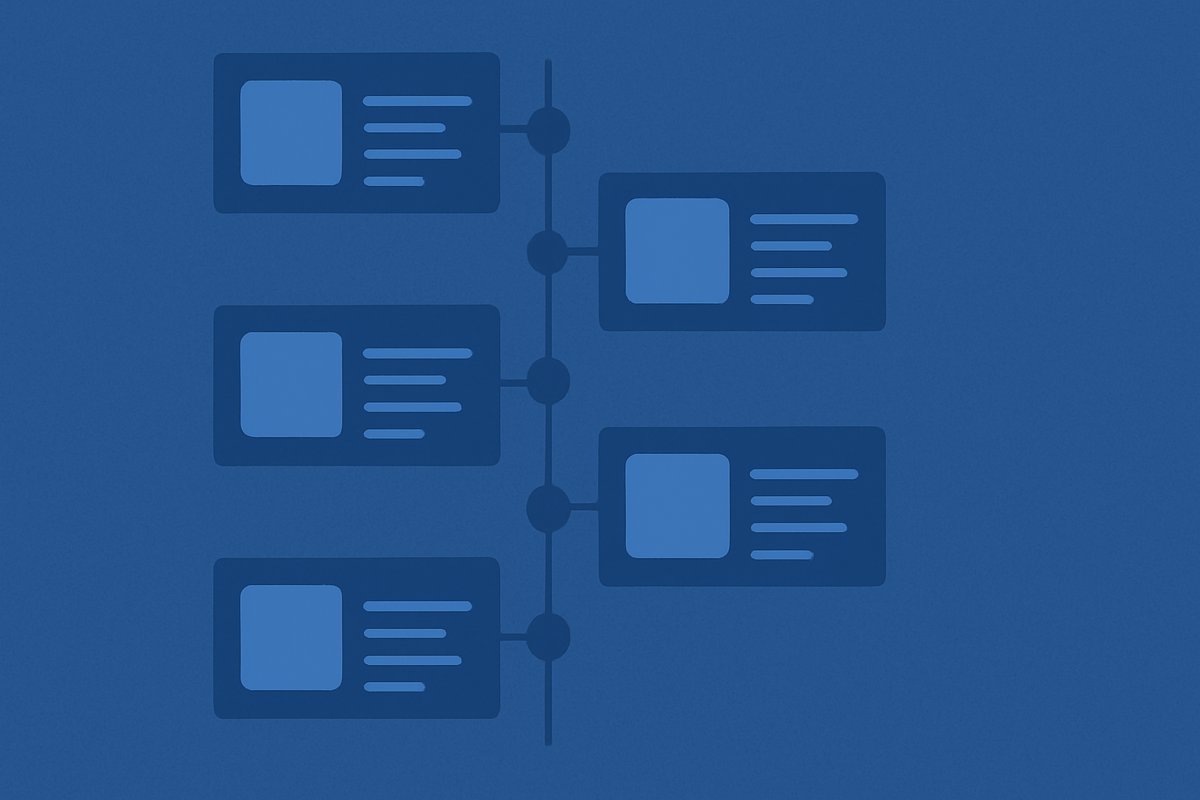
In today's installment, I'm playing around with being able to tell stories that happen over time. I wanted to be able to embed timelines right into my posts and so I've now got a custom markdig pipeline component that lets me do just that! This timeline component can be embedded directly within any Markdown content, making it easy to mix different content types within a single post. Let's see what this looks like in practice:
Launch v1
Short Markdown paragraph with an inline image: screenshot This was the initial launch of our product with basic features.
Series A Funding
Successfully raised Series A funding to scale the team and product. Funding details:
- $5M raised
- 2-year runway
- 10 new hires planned
AI Integration
Integrated AI capabilities into the core product offering. Features added:
- Smart recommendations
- Automated workflows
- Natural language processing
First Customer
We gained our first paying customer! This was a major milestone for the company. Key achievements:
- Revenue validation
- Product-market fit confirmation
- User feedback collection
International Expansion
Expanded operations to Europe and Asia-Pacific regions. New markets opened:
- United Kingdom
- Germany
- Australia
- Japan
IPO Preparation
Started preparing for initial public offering in 2025. Milestones completed:
- Financial audit
- Board restructuring
- Compliance framework
Perfectly integrated with blog post content 👏
But this is just one experiment. I'm increasingly curious about other modalities: interactive diagrams, embedded data visualizations, maybe even audio snippets or video clips that enhance rather than replace text. One source of inspiration is the work of Bret Victor, such as Up and Down the Ladder of Abstraction. Really interesting explorations of different ways to visualize how data and behavior changes over time. I'll keep plugging away!
