I've been on a bit of a journey lately exploring different ways to visualize and interact with data on my site. After creating the Article Link Map to visualize connections between posts, and building timeline components for chronological storytelling, I kept thinking about what else could be possible.
So I built Photonic — a 3D visualizer that runs right in your browser. You can try it out yourself and play around with creating 3D objects and scenes for real-time visualizations and small simulations ... all accessible from your browser.
What Is It?
Photonic is essentially a lightweight 3D rendering environment built on top of Three.js. It provides a simple API for creating and manipulating 3D objects through JavaScript. The idea is to have a flexible canvas where I can experiment with spatial visualization, whether that's for data, diagrams, or just creative coding.
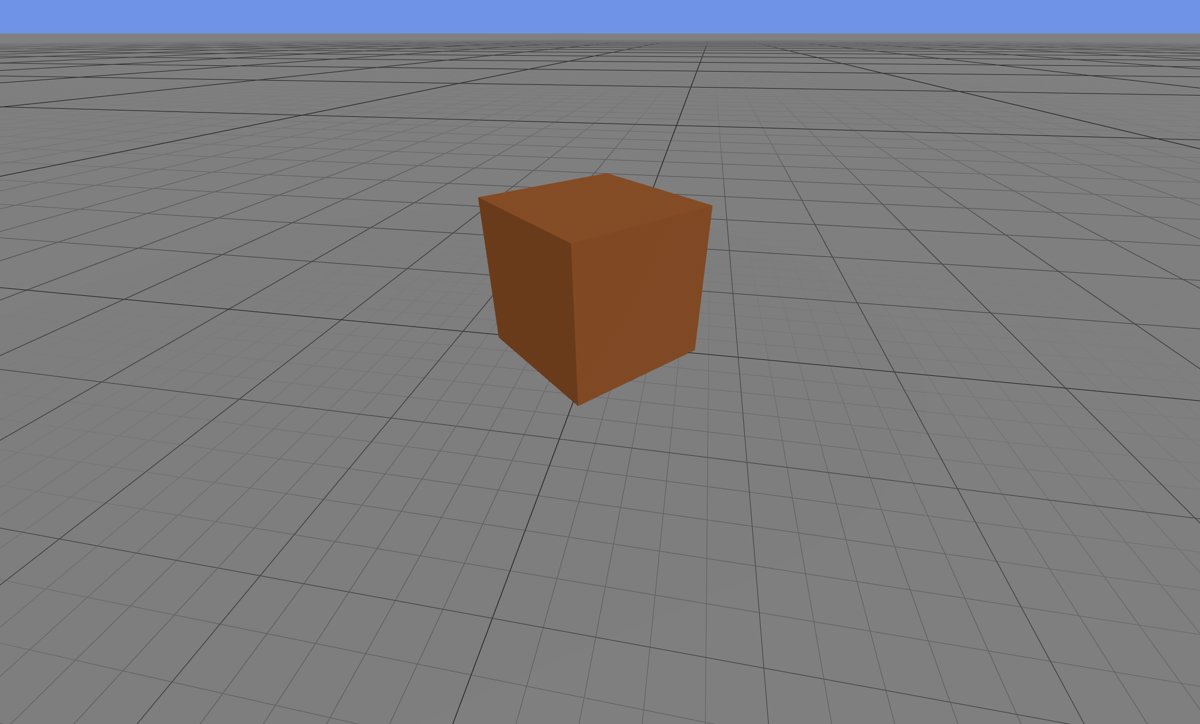
The interface is straightforward — you get camera controls (orbit, pan, zoom) and an API accessible through the browser console. Want to create a red box? Just type:
Photonic.createBox({color: 0xff0000})
Or maybe a green arrow:
Photonic.createArrow({color: 0x00ff00})
You can clear everything and start over with Photonic.clearObjects(). It's designed to be immediately accessible for quick experimentation.
You can pass module parameters directly in the URL, which allows for pre-configured scenes or demos. For example, ?module=box.js loads a specific module that sets up a scene.
This opens up possibilities for:
- Sharing specific 3D configurations via URL
- Creating reusable visualization modules
- Building a library of different scene types
The modules can define their own objects, lighting, and camera positions — essentially creating little self-contained 3D experiences.
Why Build This?
I'm continuing to explore what a personal website can be beyond just a chronological blog. The web has evolved so much in terms of what's possible with WebGL, canvas APIs, and modern JavaScript, yet most personal sites (including mine, traditionally) are still just text and images flowing down a page.
The Link Map gave me a way to visualize connections spatially. The timeline component added temporal dimension to storytelling. Photonic adds a third dimension ... literally.
I'm interested in using this for:
- Data visualization: Imagine plotting code metrics, performance data, or any multidimensional data in 3D space
- Conceptual diagrams: Some ideas are inherently spatial and might benefit from 3D representation
- Interactive experiments: Just playing around with what's possible when you give yourself a 3D canvas
This isn't meant to be a separate tool, I want it integrated into the fabric of this site. Just like I can embed a timeline in a blog post, I want to be able to embed 3D visualizations. The goal is to make this feel like a natural extension of the content, not a separate thing you navigate to.
I'm moving towards making this site more interactive overall. The static blog model has served us well for decades, but we're leaving so much potential on the table. With modern browsers, we can create experiences that respond, adapt, and invite exploration.
What's Next?
I have a few ideas I'm excited to explore:
- Embedded visualizers: Being able to drop a 3D scene right into a blog post, configured for that specific content
- Data-driven scenes: Pulling in real data and visualizing it spatially
- Interactive tutorials: Imagine explaining a concept where you can rotate, zoom, and manipulate a 3D model as you read
The web gives us an incredible canvas. I'm still figuring out what to paint on it, but experiments like this help me discover what's possible. If you're curious, go play with it — create some objects, move the camera around, see what happens.
The best way to understand a space is to explore it yourself.