First step is to add a reference to the System.Web.DataVisualization assembly
Next create a new charting controller (or simply add the action method below to an existing controller).
Finally, show the chart by pointing to the controller's path:using System; using System.Collections.Generic; using System.Drawing; using System.IO; using System.Web.Mvc; using System.Web.UI.DataVisualization.Charting;
namespace Phoenix.Portal.Controllers { public class ChartController : Controller { private Font font = new Font("Trebuchet MS", 14, FontStyle.Bold); private Color color = Color.FromArgb(26, 59, 105);
public ActionResult Index() { // Define the Data ... this simple example is just a list of values from 0 to 50 List<float> values = new List<float>(); for (int i = 0; i < 50; i++) { values.Add(i); }
// Define the Chart Chart Chart2 = new Chart() { Width = 800, Height = 296, RenderType = RenderType.BinaryStreaming, Palette = ChartColorPalette.BrightPastel, BorderlineDashStyle = ChartDashStyle.Solid, BorderWidth = 2, BorderColor = color }; Chart2.BorderSkin.SkinStyle = BorderSkinStyle.Emboss;
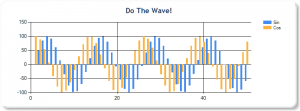
Chart2.Titles.Add(new Title("Do The Wave!", Docking.Top, font, color)); Chart2.ChartAreas.Add("Waves"); Chart2.Legends.Add("Legend");
//Bind the model data to the chart var series1 = Chart2.Series.Add("Sin"); var series2 = Chart2.Series.Add("Cos");
foreach (int value in values) { series1.Points.AddY((float)Math.Sin(value * .5) * 100f); }
foreach (int value in values) { series2.Points.AddY((float)Math.Cos(value * .5) * 100f); }
// Stream the image to the browser MemoryStream stream = new MemoryStream(); Chart2.SaveImage(stream, ChartImageFormat.Png); stream.Seek(0, SeekOrigin.Begin); return File(stream.ToArray(), "image/png"); } } }
And that's it! You get a sweet chart as seen below:<img src="/chart" />

